-
About us
![About us]()
-
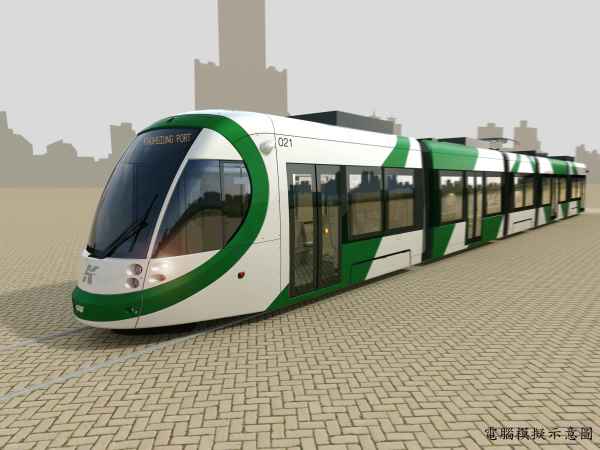
Light Rail System
![Light Rail System]()
Both of them are flexible systems. When comparing two systems, it was common to neglect their consistencies in evaluation, for example the comparison of the advanced LRT systems that have exclusive right-of-way with the BRT system that have to obey the signal-control. It will generate the wrong image that BRT will have fewer impacts than LRT. Actually they are totally difference in competitive levels. To drive Kaohsiung to be recognized as the leading public transportation development city, the introduction of good service quality, competitive, adaptive to local situation and low pollution transportation vehicles, will be the up most requirements in system selections.
Therefore, under the circumstances describe below, we will discuss the difference between LRT and BRT.
Comfortable
Have you ever experienced taking Taipei MRT? Is there any different feeling when taking Ban-Nan line (steel tracks and steel wheels) and Mu-Zha line (rubber-tired system)? The comfortable of Mu-Zha line is far from Ban-Nan line, but it doesn’t mean that Mu-Zha line has bad construction quality. The ease of Mu-Zha line is the ease of its system. Since the pavement for rubber tires is related to civil engineering, and the precision is expressed in cm. On the contrary, the steel tracks and steel wheels railway system, belongs to the scope of mechanical engineering, and the precision is expressed in mm. In other hand, the effect of seismic isolation/reduction of BRT's suspension system is lower than mass rapid system. Furthermore, it is commonly believe in worldwide that BRT is less comfortable than mass rapid system. The LRT system is the high quality and easefulness public transportation system.
Impact to the Metropolis
The LRT car is 30 m long, can carry 250 persons, and operates in multi-articulated. The BRT is 18m long, can carry 150 passengers, and operates in single car. The traffic flow analysis of Kaohsiung loop line LRT shows the rush hour demand for each direction is approximately 5000 persons/hour. By double-articulated cars, the service frequency of each direction is about 6 minutes (10 cars in 1 hour), and averagely one car will pass the cross roads in each 3 minutes. With BRT, the service frequency of each direction is 1.8 minutes (34 cars in 1 hour), and averagely one car will pass the intersection in each 0.9 minute.
| Capacity | No. of car per hour per direction | Service frequency per direction (minutes) | Average time for one car to pass cross road (minutes) | |
|---|---|---|---|---|
| LRT | 500 passengers | 10 | 6 | 3 |
| BRT | 150 passengers | 34 | 1.8 | 0.9 |
Table 1: The impact of LRT and BRT to cross roads, under the condition of 5000 persons / hour during the rush hour
Under the condition of providing the same capacity with priority at traffic signal control system, since one BRT car will pass the cross roads for each 0.9, undoubtedly it causes serious traffic problem. Consequently, canceling the priority used on signal control and reducing operation speed, but it may lower the competitiveness of BRT and becomes a non-competitive public transportation system.
Therefore, the LRT system can solely satisfy the transportation demand of metropolis area, and provide the smooth running traffic.
Environmental concern (noise and air pollution)
To compare with BRT that have intense service frequencies and loud sounds, the friction of pantographs and wheels rolling of LRT, as well as its motor driving systems will generate very low noise.
Furthermore, no matter gasoline or diesel fuel system, the BRT cars emit fumes that harm to environment. On the contrary, the electrical LRT emit no exhaust fumes, so it is non-polluting.
Operation
According to the statistics of Federal Transit Administration, the operating and maintenance cost of LRT for these recent years, is lower than BRT as the salary of drivers share 40-50% of the cost, indicates that LRT is the optimum choice to lower the operation cost of transportation.
Tendency of railway transportation
According to the statistics of Federal Transit Administration, the growth tendency of LRT during 1996-2004 is: 8 new operation units (Table 2), revenue miles add 97% (able 3), passenger trips add 40% in numbers (Table 4).
These data indicate that in the developed countries show the positive trends of the growth of LRT development, its acceptance, as well as its riderships. It is the confirmation that the suggested LRT systems might be the fittest one.

Table 2: The increasing numbers of light rail oper

Table 3: The growth tendency of revenue miles in U

Table 4: The tendency of passenger trips of USA’s
BRT vs LRT
To link to heavy rapid transit, to constitute the public transportation network, performing as a supplement, not as supplant. The type of system used will be designed due to the demand of passenger carrying capacities.
System design
| Transit mode | BRT | LRT |
|---|---|---|
| Right-of-way requirements | Mainly some shared right-of-way (street track), may develop to exclusive right-of-way, may be a mix of uses for some situations. | Predominantly exclusive right-of-way (elevated) or some shared right-of-way (at-grade), or a mix of uses for some situations. |
| Supports | Rubber tires + roadway | Steel wheels + steel tracks |
| Pilot | Driver, pilot wheel | Driver |
| Vehicle propulsion | Internal combustion engine or electric | Electric |
| Car control | Visual | Visual / sign control |
| Train length | 1 car | 1-4 cars (articulated) |
Operating feature
| Transit mode | BRT | LRT |
|---|---|---|
| Station spacing | 200-600 | 400-700 |
| Line capacity (hour/direction) | 2,000-30,000 passengers | 6,000-30,000 passengers |
| Construction cost of civil works (per km) | At-grade NT$ 35 million Elevated NT$ 400 million | Elevated NT$ 500 million At-grade ballast track bed NT$ 50 million At-grade concrete track bed NT$ 10 million |
| Cost of station (per stop) | NT$ 0.8 million | Elevated NT$ 100 million Surface bus stop NT$ 3.5 million Underground NT$ 500 million |
| Cost of vehicle (per car) | Traditional bus $4 million articulated bus $5-12 million (car capacity 70-160 persons) | $80 million (car capacity 250 persons) |
| Operating & maintenance cost (per km) | NT$ 45~50 (traditional bus) | NT$ 110~130 |
| Construction time (per 10km) | <18 months | Approximately 2 years |
| Comfort | Bad | Good |
| Items | BRT | LRT |
|---|---|---|
| Comfort | Low | High |
| Vehicle capacity (per car) | Low (160 passengers) | Hight (500 passengers) |
| Impact to traffic (on same carrying capacity) | High (due to frequent service) | Low |
| Operating cost-Per revenue miles | Low | High |
| Operating cost-Per passenger | High | Low |
| Construction cost | Low | High |
| Environmental friendly | Low | High |
Notes: Both systems use the exclusive right-of-way and signal priority